Chapter 6: PCB Analysis
I. Meaning of PCB Analysis
- PCB Definition: PCB stands for Pallet, Case, and Bulk (Piece) respectively.
- Analysis Method: This technique allocates and displays quantities into P, C, and B units based on the quantity per pallet and the items per case.
- EQ-PCB Analysis: Analyzes which packaging type (P, C, B) is used for shipment relative to each customer's order quantity (EQ).
- IQ-PCB Analysis: Analyzes which packaging units are moving relative to the shipment quantity (IQ) of each product type.
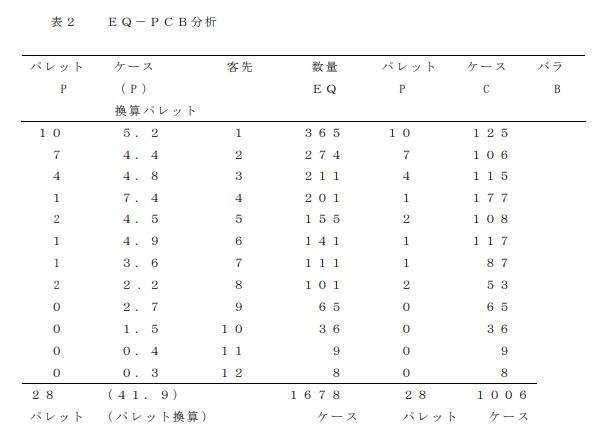
II. Example of IQ-PCB Analysis (Table 1)
- Objective: Visualizes workload by dividing shipment quantities (IQ) into actual operational forms (P, C, B).
- Data Structure:
- Actual Shipment Breakdown (Right Side): Decomposes quantities into what was actually picked in "pallet units" vs. "case units".
- Conversion Values (Left Side): Values converted into pallet or case counts based on the stacking quantity of the right-side figures.
- Calculation Example (Item 1): If an IQ of 267 cases consists of "6 pallets" and "123 cases," the conversion side captures this as a total equivalent to 11.1 pallets (6 + 123/24).
- Handling Bulk (B): If there are piece orders, the conversion side shows "how many cases worth" were broken down into bulk for shipment.
III. Total Category PCB Analysis (GIQ-PCB)
- Difference from GIQ Analysis: Simple pallet conversion (GIQ analysis) hides the "breakdown of case shipments".
- PCB Visualization: Highlights the actual work format by dividing total volume into "actual pallets" and "case-converted portions".
- Basics of System Planning: Grasping the quantities moving in P, C, and B units is the foundation of distribution center planning.
IV. PCB Analysis by Customer (EQ-PCB Analysis)
- Analysis Basics: The concept is similar to IQ-PCB, but uses representative stacking counts and case quantities to calculate estimated "rough values" as a guide.
- Example (Table 2): Sorts customers by order quantity and displays the actual order breakdown and conversion values.
- Limitations: These figures alone cannot distinguish the "number of order items"; they are used strictly as a guideline for system planning.
V. Total Customer Order Volume Analysis (GEQ-PCB)
- Definition: The sum of PCB analysis results performed on individual order quantities (EQ) in the EIQ table.
- Note: Mechanically converting units of EIQ table data does not accurately represent actual pallet and case shipment volumes.
- Importance of Reality: Accurate analysis based on actual work units (packaging forms) is essential for logistics planning.
IQ-PCB Analysis Example Image
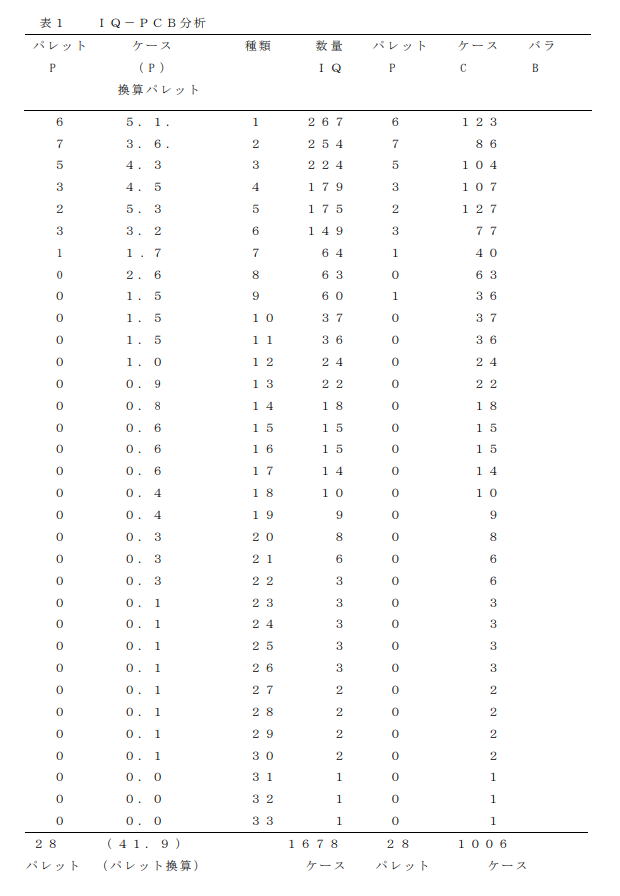
EQ-PCB Analysis Example Image